
Most companies read their AI readiness score the wrong way. Here is the pattern I keep seeing. A leader takes an assessment, gets a number like 72, and asks one question. Is that good? A good AI readiness score does not exist as a universal number, because every tool sets its own scale and its own cutoffs. A good score clears the bar for the next project you plan to run, measured on your weakest dimension and not on the average.
I should say where we sit. Elevates.AI sells a readiness assessment, so we have a stake in this question. We also gain nothing when you trust a number you cannot defend. For the definition and the calculation method, see our explainer on what an AI readiness score is. This post covers how to read a result once you have one.
Why can the same score mean three different things?
Take an organization that earns 75% of the maximum on three published scales. The table shows how each framework labels that identical result.
| Source | Scale | Where 75% lands | Published label |
|---|---|---|---|
| Classic Informatics, AI readiness assessment guide | 0 to 12 | 9 of 12 | Ready |
| RaftLabs, AI readiness assessment guide | 0 to 100 | 75 | Ready with targeted preparation |
| Cisco AI Readiness Index, 2025 methodology | 0 to 100 | 75 | Chaser, moderately prepared |
The organization and the percentage stay the same while the verdict changes three times. One scale says go. One says prepare first. One places you in the middle of the pack. The Classic Informatics guide and the RaftLabs guide do not explain how they derived their cutoffs, which makes the label a design choice and not a measurement.
Cisco documents its construction. Its methodology page scores 49 indicators across six pillars. It credits full deployment at 100%, partial deployment at 25% to 50%, and no deployment at 0%. Cisco then classes a score of 86 or above as Pacesetter, 61 to 85 as Chaser, 31 to 60 as Follower, and 0 to 30 as Laggard. That is a transparent ruler, but it is still one company’s ruler.
The bands differ because each author is answering a different question. A consultancy that sells a two week engagement draws the ready line where its engagement makes sense. An index that tracks a population draws it where the top group separates from the rest. Neither choice is wrong, but neither one is neutral about your situation.
A score is a measurement on someone else’s ruler. Before you ask whether it is good, ask what the ruler is.
If you want the specific version of this for your organization, the free 60-second assessment maps it.
Where does the typical organization actually land?
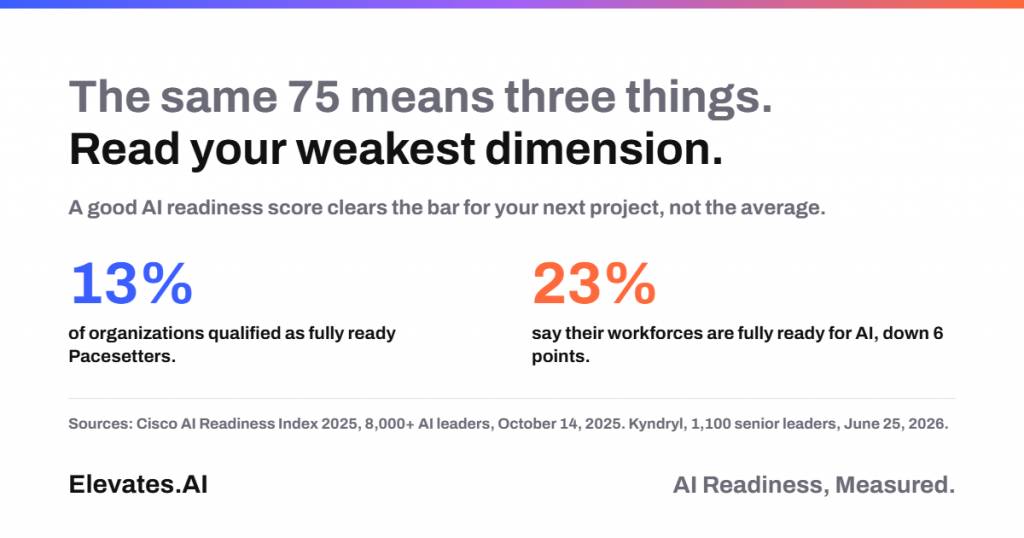
A better reference than a vendor band is the population. Cisco’s 2025 AI Readiness Index surveyed more than 8,000 AI leaders across 30 markets and 26 industries. About 13% qualified as Pacesetters, the fully ready group, and that share has held for three years. Cisco published the finding on October 14, 2025. It is a vendor-run index, so read it as a signal and not a verdict.
Other 2026 sources point the same direction. Kyndryl surveyed 1,100 senior leaders across eight countries and reported on June 25, 2026 that 23% say their workforces are fully ready for AI, down 6 points from last year. Over the same period full AI integration rose from 35% to 57%. Publicis Sapient’s survey of 1,550 AI decision-makers, published June 17, 2026, found 73% use AI regularly or across most processes while only 10% say AI is core to how the business operates. Deployment is running ahead of readiness.
The newest reading is narrower and harsher. On October 13, 2026, Further published a survey of 515 U.S. AI decision-makers. Only 5% called their data largely AI-ready, and only 3% had a documented process for auditing AI. Further sells data and AI services and its release does not disclose its sampling method, so treat those figures as directional.
Together these sources give you an AI readiness score benchmark that is more useful than any vendor band. If about 13% of organizations clear the fully ready bar on a broad index, and fewer clear it on data or governance, then scoring above the median does not mean you are ready. Average is a low bar. Your score only means something against the project you want to run.
What does a high readiness score actually predict?
The most useful evidence is what the fully ready group does differently. In the same Cisco release, Pacesetters were 4 times more likely to move AI pilots into production. 62% had a mature, repeatable innovation process against 13% overall, and 77% had finalized their use cases against 18% overall. Cisco also reported that Pacesetters were 50% more likely to see measurable value from AI.
Notice what those numbers describe. They describe process and decisions, not model quality or budget. A high score matters because it tracks whether your organization can repeat the move from idea to production. Cisco’s data shows an association and not proof of cause, but the pattern matches what we see in stalled pilots.
The gap described above is the one a short AI readiness assessment surfaces first, and it takes about a minute.
What should a good AI readiness score include?
A good AI readiness score has three properties. It states its scale and its cutoffs. It shows each dimension separately. And it ties a result to a decision. Without the third, you receive a number that feels informative and changes nothing.
- A stated scale. You should find the maximum and the cutoffs on the page, along with a sentence on where they came from.
- Dimension scores. Cisco scores six pillars, covering strategy, infrastructure, data, governance, talent, and culture. Classic Informatics scores four. Either way, a single blended figure hides the dimension that blocks you.
- A decision attached. A result that says not ready should say not ready for what, and what to fix first.
Most AI readiness assessment results fail the third test. They hand you a label and leave the sequencing to you. That gap is where a lot of the value gets lost.
Why does your weakest dimension matter more than your average?
Averages hide the constraint. Picture two organizations that both average 70. The first scores 70 on every dimension. The second scores high on strategy and talent and low on data. The table uses illustrative numbers and not survey data.
| Dimension | Organization A | Organization B |
|---|---|---|
| Strategy | 70 | 95 |
| Data | 70 | 40 |
| Governance | 70 | 50 |
| Talent | 70 | 95 |
| Average | 70 | 70 |
The first organization can start a modest pilot next week. The second will stall at the first integration, because data is the dependency for everything else. Classic Informatics makes the same call in its guide. It tells readers to fix data first, and for the middle band it advises closing the lowest dimension before starting a pilot. That instinct works on any scale.
The Kyndryl data shows where the weak dimension often sits. Only 33% of organizations have clear policies on which decisions AI may make, and 27% run a registry and monitoring across all their AI systems. Governance is where many strong averages break.
Can you trust a score you gave yourself?
Self-scored results run high. Classic Informatics says so directly and recommends an outside review for that reason. In our reading the cause is simple. The person answering knows what was planned and not always what shipped. A question like do you have a governance policy gets a yes when a draft exists.
Two habits reduce the inflation. Answer with evidence you could show a colleague, such as a document, a ticket, or a dashboard. And have a second person score the same dimensions without seeing your answers. Where the two scores differ by more than one level, you have found something worth a conversation.
How do you act on your score in one week?
A score is a sequencing instruction. Classic Informatics uses that phrasing and it is a useful one. Work through the steps below within a week of getting your result.
- Write down the scale, the maximum, and the cutoff for ready. Convert your result to a percentage of the maximum so you can compare it with other tools.
- Sort your dimensions from lowest to highest. The lowest one is your constraint.
- Name the next project you plan to run and ask what it needs from that dimension.
- Decide one of three things. Proceed, fix the constraint first, or choose a smaller project the constraint can support.
- Put a re-score on the calendar. Classic Informatics suggests about every two quarters.
Here is a worked example using Organization B from the table. Its next project is a support assistant that answers customer questions from internal documents. That project depends on clean, current documents, which is a data question. The data score of 40 says the project will underperform. Organization B can fix the knowledge base first, or it can start with a smaller internal tool built on a curated document set. Either path respects the constraint. Launching the original project and hoping the strategy score carries it does not.
Most teams skip step three. They treat readiness as a general condition and not as a fit between a project and a gap. Our post on what to do after your assessment walks through that fit in more detail.
Do not chase a higher number. Chase a higher floor. Start with the 60-second readiness assessment and you will know which gap blocks the others before you spend anything.
If you also want to separate readiness from maturity before you compare scores, we cover the difference in AI maturity vs AI readiness. The two terms get mixed up on many scorecards, and the mix-up inflates results.
Bring three things to your next planning meeting. Bring the scale and cutoff behind your number, your lowest dimension, and the one project that dimension can support today. That short list turns a score into a decision, which is the only reason to take the assessment at all.
So what is a good AI readiness score? It is a floor you can defend on the dimension your next project depends on, read on a ruler you understand. Write that down this week.
Frequently Asked Questions
What is a good AI readiness score?
There is no universal good AI readiness score, because each tool sets its own scale and cutoffs. A good result clears the bar for your next project on your weakest dimension. As a reference point, Cisco’s 2025 index put its fully ready group at 86 or above on a 0 to 100 scale, and only about 13% of organizations reached that group.
Is 70 out of 100 a good AI readiness score?
It depends on the scale. On Cisco’s index a 70 falls in the Chaser group, which Cisco calls moderately prepared. On the RaftLabs bands a 70 reads as ready with targeted preparation. Check your lowest dimension before you decide what the number means.
What is the average AI readiness score?
No public figure covers all tools, because the scales differ. The closest reference is the distribution of organizations by readiness. Cisco found about 13% fully ready, and Kyndryl found 23% say their workforces are fully ready.
How often should you retake an AI readiness assessment?
Classic Informatics suggests about every two quarters. It also makes sense to re-score after a major change in data, tooling, or governance. A new score shows whether your constraint moved.
What should you do after a low score?
Treat it as a sequencing instruction and not a verdict. Fix the lowest dimension first and pick a smaller project that dimension can support. Then re-score to confirm the constraint moved.
Be the First to Discover New AI Insights
Follow Elevates.AI on Google to stay updated with the latest AI readiness assessments, governance frameworks, implementation guides, buyer's guides, and enterprise AI best practices.
 Follow Elevates.AI on Google
The AI Readiness Brief
Every Week, receive practical enterprise AI strategies, implementation frameworks, governance updates, and expert insights—all delivered in a 5-minute read.
| ✓ Enterprise AI Strategy | ✓ AI Readiness Frameworks |
| ✓ Governance & Compliance | ✓ Exclusive Guides & Resources |
Join 500+ AI Professionals
Enter your work email below to receive one high-value email every week. No spam. Unsubscribe anytime.